 |

1. The plan remains positive
The final result of the 2008 fiscal year was negative as a direct consequence of the crisis, which slashed the value of the stock traded at the São Paulo Stock Exchange and in the rest of the world.
Considering the Plan had closed 2007 with 65.73% of its assets invested in stock, the strong devaluation of these assets affected the profitability of the investment portfolio as a whole.
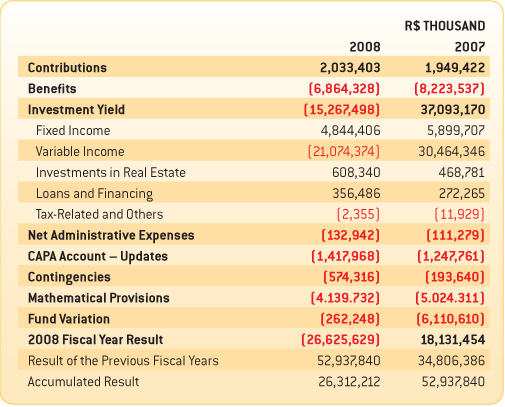
In final numbers, the result of the 2008 fiscal year was negative by R$26.626 billion. Of this total, nearly R$15 billion correspond to the negative profitability of the investment portfolio, some R$5 billion are related to the update of mathematical reserves and funds, while nearly R$6 billion correspond to benefit payments.
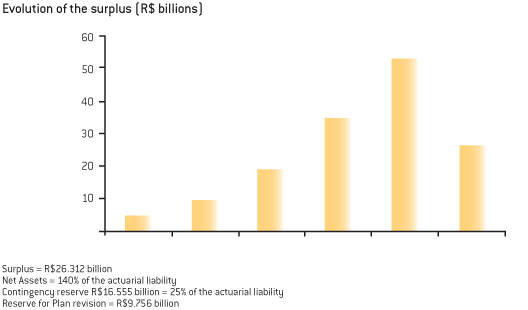
In spite of the negative result in the year, the accumulated result remains positive. The accumulated surplus was R$26.312 billion, of which R$16.555 billion entered the Contingency Reserve, while R$9.756 billion the Special Reserve for Plan Revision.
The conclusion is that, notwithstanding the significant losses, the Plan’s coverage index is still 140% of the actuarial liability, i.e., a great safety margin. What happened was the burn-off of accumulated “fat,” without this representing a threat to the Plan’s solvency level. Given the dimension and depth of the crisis, the final result can be considered a stress test for the Plan.
Result Composition – Plano 1
The value of the Contributions item is composed, essentially, of ordinary contributions, with resources coming from the Contribution Fund (some R$703 million) and from the Pre-1967 Capa/Group Account (approximately R$1.308 billion).
The amount of the Mathematical Provisions is calculated based on the Plan’s actuarial premises, which include benefit readjustments, wage growth, biometric tables, the actual interest rate, administration fees, among other items.
Discussion on the destination of the surplus suspendedConsidering the high surplus calculated in the closing of the 2007 fiscal year, 2008 started with generalized expectations on new surplus usage measures. Two events, however, impacted this process, postponing and then suspending the discussions.
The first event was regulatory in nature. The Office of Supplemental Pension Plans announced its intention to submit a rule on surplus calculation and destination, which was in fact approved on September 29 2008.
The second relevant reason was the eruption of the crisis and its impact on the Plan’s financial status.As of the late first half of the year, it became increasingly clear that the 2008 result would consume part of the surplus that was to be discussed.
Because of this, the discussions regarding surplus were suspended. Whether or not it will be resumed will likely depend on a few conditions: clearing of doubts that have already been reported on regarding the provisions of Resolution 26; the clarification of the consequences of law suits already filed against the Resolution; the assessment of the Plan’s economic and financial status; and the possibility to dispose of the Special Reserve.
Evolution of the surplus (R$ billions)
1.1 Benefit payment
An important characteristic of Plano 1 is the major volume of benefits paid every year. In 2008, this amount totaled R$5.793 billion actually paid to 84,238 retirees and pensioners.
Considering Plano 1 currently has its contribution collections suspended, benefit payment is supported by the revenue that comes from the Investment Program: income from leases, dividends, interest on securities, and the sale of assets.
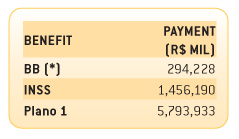
Benefit Plan
(*) Basically the payment of pensions previous to 1967 and legal demands.
1.2 Profitability: history and conjuncture
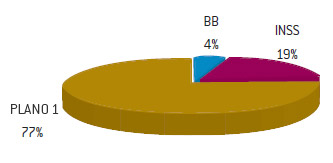
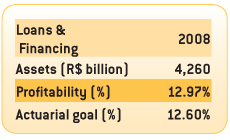
Plano 1’s Investment Program’s profitability closed the year at -11.49%, compared to the actuarial goal of 12.60%. The segment that contributed to the negative performance was Variable Income, the profitability of which was -24.04%. Plano 1’s stock portfolio closed 2008 at R$66.246 billion, or 57.45% of total investments.
In previous fiscal years, Plano 1’s profitability stood out as the first among the top 10 of the social welfare institution employees, with a performance leveraged by investments made in stock. In 2008, the scenario was inverted, but in terms of accumulated results, it remains positive (see Accumulated Performance Analysis in this Report).
Compared to indices that are the main market benchmarks – Ibovespa and IBrX-50, the accumulated profitability of Plano 1 had its best performance in the past five years.
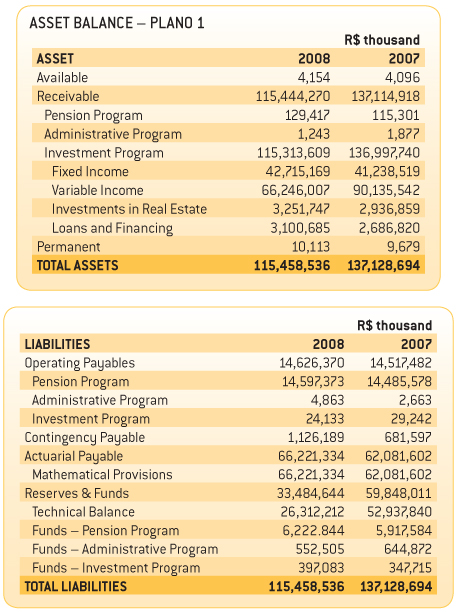
1.3 Assets
Plano 1 closed the year with total Assets worth R$115,458 billion, down from R$137.128 billion in 2007. The reduction resulted from the combined effect of negative profitability and from the payment of benefits and other expenses that caused the Plan to shed resources.
Asset distribution is still concentrated on Variable Income which, notwithstanding the effects of the crisis, accounts for 57.45% of the total. In 2007, Variable Income assets accounted for 65.73% of the total.
Pursuant to the rules, PREVI should adjust its investments to the limit of 50% in Variable Income through 2012. A new decision laid down by the National Monetary Council, however, postponed this deadline to 2014.
In Liabilities, the most relevant variation took place in the Mathematical Reserves which, on account of the annual actuarial update, increased from R$62.081 billion to R$66.221 billion.
2. Segments
2.1 Variable IncomeThe Variable Income assets account for 57.45% of Plano 1’s investments. The segment’s profitability was -24.04%, compared to the 50.94% obtained in 2007. Nonetheless, the performance was still better than that achieved by IBrX-50, one of the capital market’s main benchmarks, which closed 2008 with an accumulated index of -43.14%.
The stock market experienced two entirely distinct moments in the year. The first half of 2008 was marked by optimism and highs. On May 20, the Bovespa Index closed at 73,516 points, a gain over the 2007 closing. From then on there was an ongoing loss process, with a small period of stability around 50,000 points between August and September, only to then crash to its lowest level, at 29,435 points, on October 27.
It was very difficult to react to this scenario. During the first reduction movement, most analyses indicated there would be a swift return to the growth trend. When the loss process set in, the pace was so fast and the business volume fell so abruptly that any operation, whether a sale or a purchase, was a high-risk operation. Considering the size of Plano 1’s portfolio, the reaction was a nearly complete suspension of the sales operations scheduled for the year.
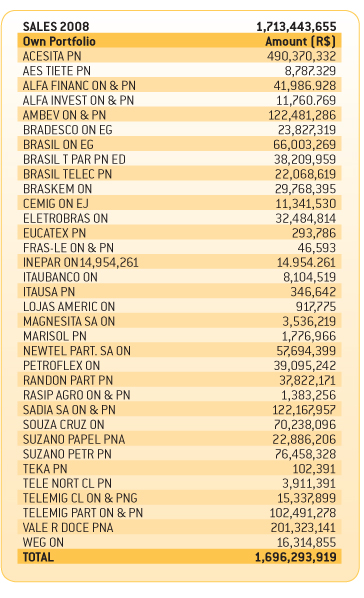
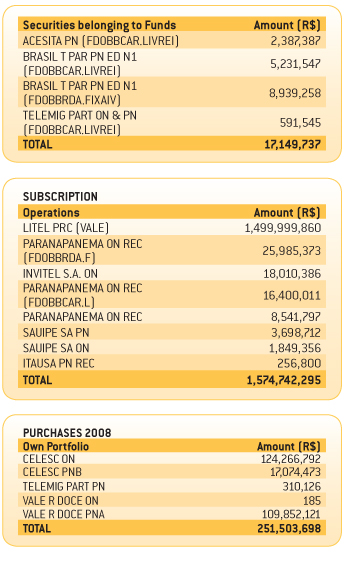
Stock sales, budgeted at R$5.7 billion, ended up topping out at R$1.7 billion. Considering that in the same fiscal year PREVI participated in the Vale’s capital increase operation (aiming to not be diluted in the control block) and received Celesc stock as part of the guarantee of investments in Invesc debentures, among other small events, stock acquisition wrapped 2008 up at R$1.826 billion. It must be emphasized that the resources obtained from the sale of stakes in BrT will only be entered in 2009.
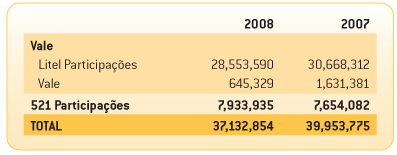
The -24.04% final result, better than the sector’s average performance, derived from the high percentage of our portfolio allocated to assets appraised based on the “economic value” criterion. As announced in the past few years, the stakes held in Litel/Valepar/Vale and 521/Neoenergia and CPFL will be entered based on their economic value. Since we adopted conservative criteria in these evaluations, there was not a significant variation in the current scenario.
Appraisals (R$ mil)
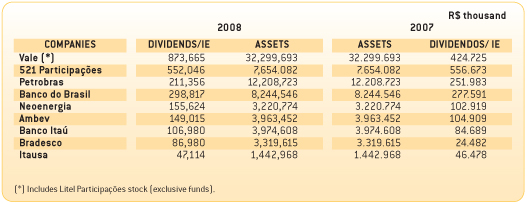
The good performance the companies had in 2008 was reflected in the payment of dividends and interest on equity (IE) for the amount of R$3,092 billion in 2008, which contributed to benefit payment. More precisely, they totaled 53% of the benefits paid.
Major operationsIn spite of the scenario of uncertainty and crisis, a few important operations were carried out in 2008, increasing the value of relevant assets.
The most important operation was the one that involved Oi and Brasil Telecom. PREVI’S stakes in Brasil Telecom were sold for R$1.630 billion (although negotiated and approved in 2008, this sale was only liquidated in January 2009).
Another relevant operation was the sale of the stakes in Metrô-RJ and its absorption in Invepar, giving rise to the company’s expansion to the concession sector.
2.1.1 PortfoliosPREVI’S Variable Income segment is spread over five portfolios: Interests, Restructuring, Market, Special Management, and Outsourced Portfolio. The goal is to secure better quality in asset management and systematically follow-up on liquidity and governance indices, for example.
2.1.1.1 StakesThe assets PREVI holds stakes in controlling blocks in account for 60.68% of the portfolio. The profitability of these stocks, in 2008, was -6.76%. Since 2006, in compliance with the determination laid down by the Securities Exchange Commission (CVM), which appears in official letter CVM/GMA-3/nr 0072, of 04/25/2006, PREVI has been adopting annual periodicity for reappraisals, based on the economic value, non-liquid assets held via funds. The non-liquid stocks in the own portfolio also started being reappraised based on the economic value, in order to obtain equanimity in value for such assets, whether they are allocated to the Own Portfolio or to investment funds.
2.1.1.2 RestructuringAn important example of the stakes that were in this portfolio in 2008 was the Paranapanema holding. With the sale of assets and liquidation of debentures, the financial restructuring process was completed in November. This was a debt which, in the middle of the year, hovered around R$1.35 billion.
In the worst phase, Paranapanema’s debt had surpassed the company’s economic value. The holding now has an appropriate cash status and kicks-off 2009 debt free. PREVI’S stakes in the holding, which had been as high as 49%, has now been diluted to some 24% of the company’s total capital.
The portfolio’s profitability was -22.39%. The assets account for 6.29% of the Variable Income segment’s total value.
2.1.1.3 MarketThe portfolio has R$21.914 billion in assets, or 31.6% of the total investments in the segment. It includes the most traded securities at Bovespa, in terms of number of transactions and financial volume, with good return perspectives, such as Banco do Brasil, Petrobras, Ambev and Embraer, which compose the IBrX-50 index. Profitability was greatly impacted by the economic crisis, and stock prices were down by -43.35%, slightly worse than the IBrX-50 performance, at -43.14%.
2.1.1.4 Special ManagementStock of companies that did not fit into the other portfolios, with resources in the order of R$192.353 million, equivalent to 0.28% of the investments in Variable Income. In 2008, profitability was -38.26%, i.e., performance was better than that of IBr-X50, at -43,14%.
2.1.1.5 Outsourced PortfolioComposed of short-term operation securities and management securities via investment funds (BB Ações Price, FIEE, Fundo Infra Brasil, among others). Profitability was -46.86%. The portfolio’s resources are of the order of R$56.597 million, i.e., 0.08% of the total Variable Income segment.
Investments in private equity and venture capital stand out as alternatives to seek for better returns in the long term and for greater portfolio diversification. The investments are made especially by means of interest in Interest Investment funds (IIF) and Funds for Investments in Emerging Countries (FIEC). In late 2008, PREVI was investing in 13 funds, with a total of R$750 million paid in. PREVI participates in the funds’ investment committees, and the investments emphasize companies in the logistics, infrastructure, and sustainability project areas.
2.2 Fixed Income
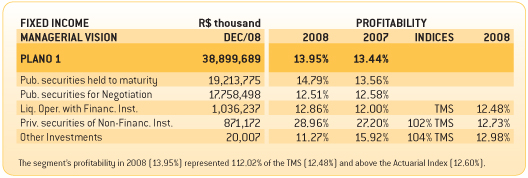
The Fixed Income portfolio’s profitability of Plano 1 was 13.95%. Since a few Fixed Income funds also hold assets in Variable Income in their portfolio, for analysis purposes, these Variable Income assets have been deduced. The portfolio’s total value was R$38.899 billion, compared to R$36.849 billion in 2007. It is noteworthy that these amounts differ from those shown in the Accounting Statements, which are R$42,715 billion and R$41.238 billion, respectively. Without the deduction of the Variable Income assets, Plano 1’s Fixed Income portfolio had a profitability of 12.23%, slightly lower than the Average Selic Rate in the year, which was 12.48%.
The Fixed Income market also experienced different moments during the year.
The first moment was marked by concern (in Brazil and in the world) with the beginning of an inflationary surge, forced by the increasing demand, particularly on commodities. On account of this concern, the Copom (the Central Bank's Monetary Policy Committee) started a process of increasing the Selic Rate. The higher interest on the short term had a negative influence on the value of the pre-determined long-term securities value, the contracted interest rate for which went on to be considered little attractive compared to the short-term interest rates.
With the surfacing of the crisis, the concern with inflation was set aside and the fear of recession became the main focus, with the appreciation of the pre-determined securities on account of the perspectives of lower interest rates.
PREVI adopts two accounting criteria the legislation allows for to register Fixed Income securities. A part of the portfolio, composed of securities available for trading, gets the so-called “mark to market,” i.e., it reflects the price at which these securities are currently being traded. Another part of the portfolio, composed of securities with more extended maturity dates, gets the so-called “marking for securities kept to maturity,” i.e., each security is entered at its acquisition value added of the interest foreseen for each period.
PREVI’S strategy of acquiring pre-determined securities with more extended maturities is based on a vision of protecting future commitments, taking advantage of the interest rates that are currently being practiced and surpass the actuarial interest rate of 5.75% p.a.
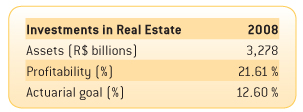
2.3 Real EstateThe profitability of the segment – formed by stakes in shopping centers, office buildings, hotels and other units – was 21.61% in 2008. The portfolio’s total value reached R$3.278 billion.
In addition to the appreciation of the properties, which takes place when the units are reappraised, the portfolio results from the receipt of rent and income, which in 2008 totaled R$243 million.
Investments – Real Estate
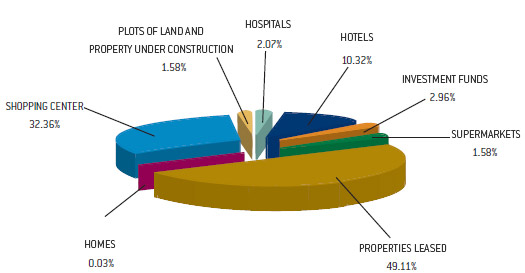
Plano 1 holds stakes in 14 shopping centers, the value of which adds up to R$1 billion. These projects have been benefitted by the higher buying power families have achieved and have reached 38% profitability, standing out in the real estate segment.
To keep pace with shopping center performance, PREVI attends all owner/condominium meetings seeking to have good management, transparency and project appreciation practices adopted. Additionally, PREVI has also participated in renovation and expansion investments, such as those made in the Morumbi Shopping (SP), Barrashopping (RJ), and Parkshopping (DF).
The hotel segment
We continued restructuring and selling the Sauípe Complex, and remain without a solution for the building that was home to the Meridien Hotel, in Rio de Janeiro. We expect there to be a solution for both cases in 2009.
Umberto Primo
In 2008, direct understandings were reached between PREVI and the São Paulo Federal Prosecutor’s Office, which is in charge of foundation curatorship (in this case, the Umberto Primo Foundation, the previous owner of the property). These understandings pave the way towards a solution for the several legal pendencies and to allow for a profitable destination for the project.
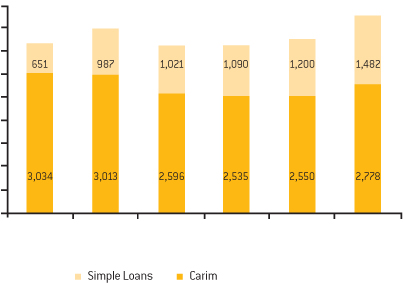
2.4 Loans & FinancingTotal value of the agreements (R$ million)
2.4.1 Simple LoansThe volume of resources allocated to loans made to participants was R$1,482 billion at the end of the 2008 fiscal year, in 60,754 agreements. The average value of the agreements was R$24,000, and the portfolio’s profitability was 14.07%, above the actuarial goal of 12.60%. The minimum the law requires is INPC + 5.75%. The difference between profitability and the actuarial goal derived from the fact that PREVI updates the outstanding balances based on the INPC of the previous two months.
For Plano 1, the year was marked by an increase in the concession cap, from R$35,000 to R$50,000, with a grace period of 12 installments paid for renewal, in the ES Series 10, 12 and ES Finimob modes. By the end of the financial year, 9,979 operations had been carried out under the new cap, with a net financial volume of R$168 million.
2.4.2 MortgagesThe new Mortgage Portfolio (post-2007) wrapped the year up with 2,158 agreements worth, in total, R$314 million. This figure is contained in the portfolio’s total, which adds up to R$2.778 billion and encompasses 29,601 agreements. Profitability was 12.05%.
All of the 7,967 participants of Plano 1 who showed interest in financing through the website’s self-service feature or via the 0800-729-0505 toll-free customer service center were summoned. A total of 2,518 financings have already been granted since the portfolio reopened, in December 2006, with values equivalent to upwards of 10% of the portfolio’s total volume.
Of this total, 1,895 agreements were signed in 2008 and moved some R$230 million. All of those who showed interest in financing got the summons letter.
Profitability was 12.05% and it is different from that of Simple Loans because 28.18% of the mortgages granted before 1995 were indexed based on the TR.
2.4.4 Substituição de garantiasFoi concluída a reestruturação do processo de substituição de garantia dos financiamentos imobiliários, com a contratação de empresas especializadas na condução dessas operações. A mudança trouxe benefícios para os mutuários, com o aperfeiçoamento do atendimento e da segurança dos processos.
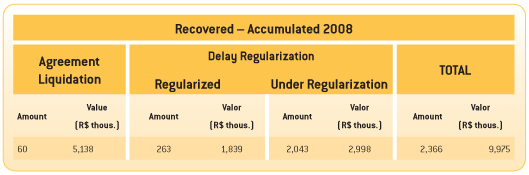
2.4.5 Reduction of delinquency and credit recoveryPREVI structured the process to collect and negotiate delinquency and delays in Mortgage agreements which, in 2008, resulted in the immediate recovery of approximately R$10 million.
Sixty agreements were liquidated, while 263 other ones regularized, with monthly installment payments resumed.
2.4.6 Redução de inadimplência e recuperação de créditosA PREVI estruturou processo para cobrança e negociação da inadimplência e atrasos nos contratos de Financiamento Imobiliário que, em 2008, resultou na recuperação imediata de aproximadamente R$ 10 milhões.
Sessenta contratos foram quitados e outros 263 tiveram situação regularizada, com a volta do pagamento das prestações mensais.