
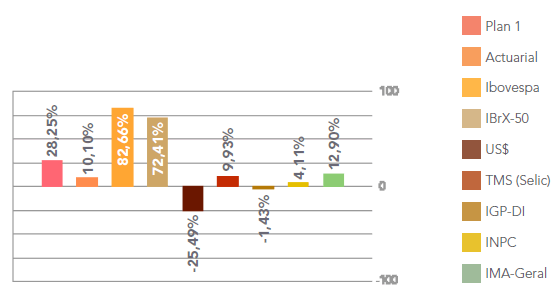
If 2009 could be summarized in a single word, it would be “recovery”. After the significant losses that took place in 2008 as a result of the global economic crisis, and after the unclear scenarios in the first few months, the year of 2009 took off and brought some positive surprises. The Plan’s profitability was 28.25%, far greater than the actuarial target of 10.1%.
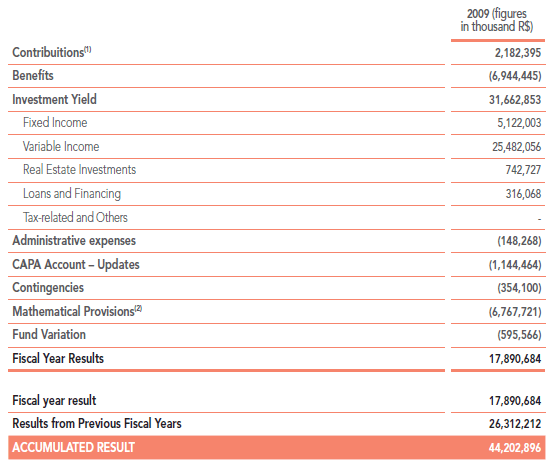
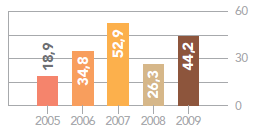
The operational surplus, which had declined last year, began to grow and is currently accumulated at R$44.2 billion. Although this sum does not approach the pre-crisis level, which reached its peak at R$52.9 billion, 2009 showed an increase of R$17.9 billion in a single year. If one takes into account that in these two years, Plan 1 paid out approximately R$12 billion in benefits, it becomes clear that these are excellent results. For its members, this value represents solidity and security to afford benefit and pension payments for many years. Finally, it is worth mentioning that the Plan annually pays out R$5.88 billion to more than 87,000 retirees and pensioners.
Net Worth Assets
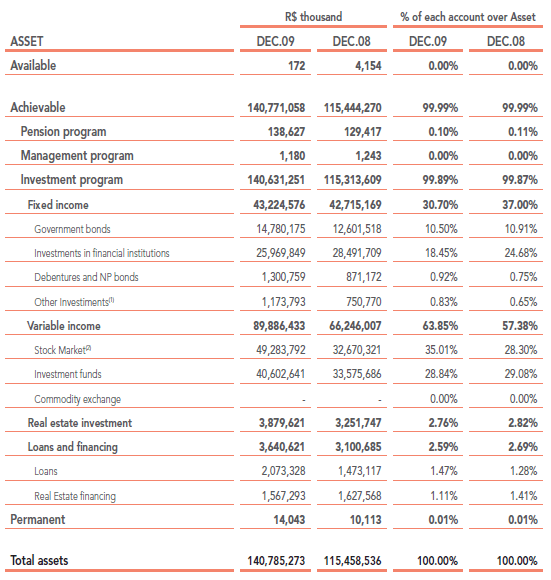
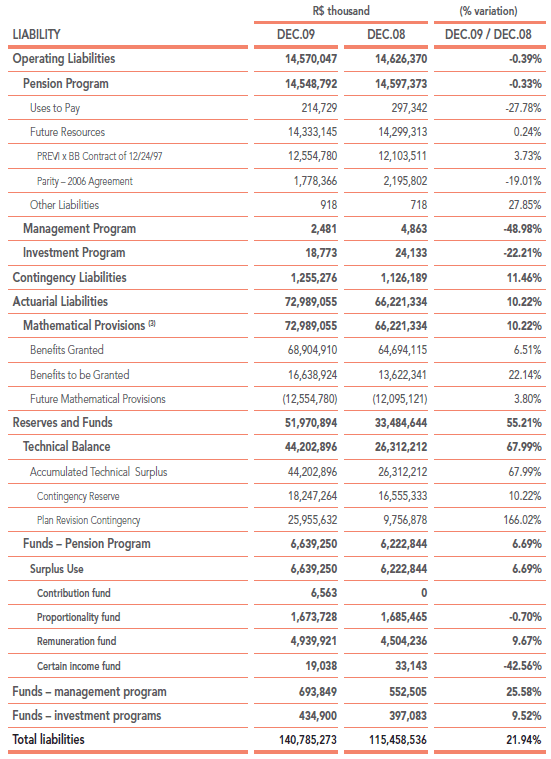
At the end of the year, the Plan’s net worth was appraised at R$140.785 billion. This means that the Plan recovered from the losses suffered in 2008 after the global economic crisis, when net worth was valued at R$115.458 billion. When one compares this with figures from 2007, when net worth was valued at R$137.128 billion, it becomes clear that the recovery surpassed the pre-crisis levels and net worth is greater than previous years.
The investments generated R$31.7 billion, the result of an excellent performance on the part of the variable income assets.
Mathematical Provisions increased by R$6.8 billion, meaning that the obligations with the permanent payment of benefits also grew by this same amount. This number already contemplates the reduced interest rate of 5.5% and the change in actuarial table to AT-2000, factors that account for $2.5 billion of the above-mentioned increase.
Throughout the year, resources of R$ 154.99 million were destined to the administrative program (the 5% load fee on contributions and reimbursement of the investment plan’s administrative costs), which correspond to 0.11% of Total Assets.
PLAN 1 BALANCE SHEET
(1) FIDC PIPS Fund, Commitment Transactions, and Acknowledgement of Debt.
(2) After January 2009, the Variable Income assets that were allocated in the Fixed Income segment started to be calculated in Variable Income, forming the calculation base for the framing plan.
The annual results were positive in R$ 17.89 billion, as shown in the table below:
(1) The value of the Contributions entry is essentially made up of ordinary contributions, with resources from the Contribution Fund as well as resources from the CAPA Grupo Account before 1967, in order to pay for the benefits of the group, which are the Bank’s responsibility.
(2) The sum of the Mathematical Provisions is calculated using the Plan’s actuarial assumptions, which include, among others, benefit readjustments, wage increases, biometric tables, real interest rates and administrative fees.
By the end of the year, Plan 1 had an accumulated profitability of 28.25%, far greater than the actuarial target of 10.10%.
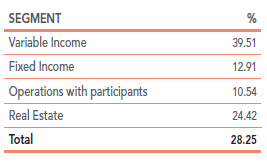
The profitability of the variable income segment of the plan, which was of 39.51%, differs greatly from the Stock market reference rates (Ibovespa and IBrX-50). The reason for this is that the Stakes Portfolio grew by only 5.49% in 2009 and this portfolio contains PREVI’s main assets. It represents 53.43% of the variable income segment and 83.32% of its net worth is composed of assets from Litel (Vale), Neoenergia, 521 Participações and Invepar.
These assets are evaluated using the “economic value” criterion, which uses conservative assumptions, and therefore did not increase significantly in value in 2009. Conversely, in 2008 (the year of the global economic crisis), while Ibovespa showed losses of 41.22%, these same assets contributed to avoid comparable losses to the Plan, which suffered losses of only 11.49% that year.
Segments
1 Variable Income
Variable income assets account for 63.9% of the investments of Plan 1. The new regulatory framework for the sector, updated by Resolution number 3,792 of the National Monetary Council (CMN, in Brazil), allows for the allocation of up to 70% of resources that guarantee the Plan in variable income. Although PREVI is currently bought out at its macrolimit, there are sold positions through assets.
Given the scenario of a reduced economic base rate (Selic - the interbank discount rate), it was necessary to look for options that could offer profitability rates to match Plan 1’s growing pension obligations.
The profitability of the segment in 2009 was of 39.51%. The year began with the same high level of volatility as in 2008, with high risk aversion. It was very difficult for analysts to predict how the market would react throughout the year. However, in a way that was quite remarkable, Brazil showed unprecedented strength and stability, which was reflected in the stock market. Turnover returned to pre-crisis levels and the business recovered most of the losses suffered in 2008. Ibovespa, the Sao Paulo stock exchange index, reached 68.588 points, with an accumulated variation of 82.66%, while the IBrX-50, the index of the fifty top traded stocks in the São Paulo stock exchange, reached 9.562 points, with a variation of 72.41% in 2009.
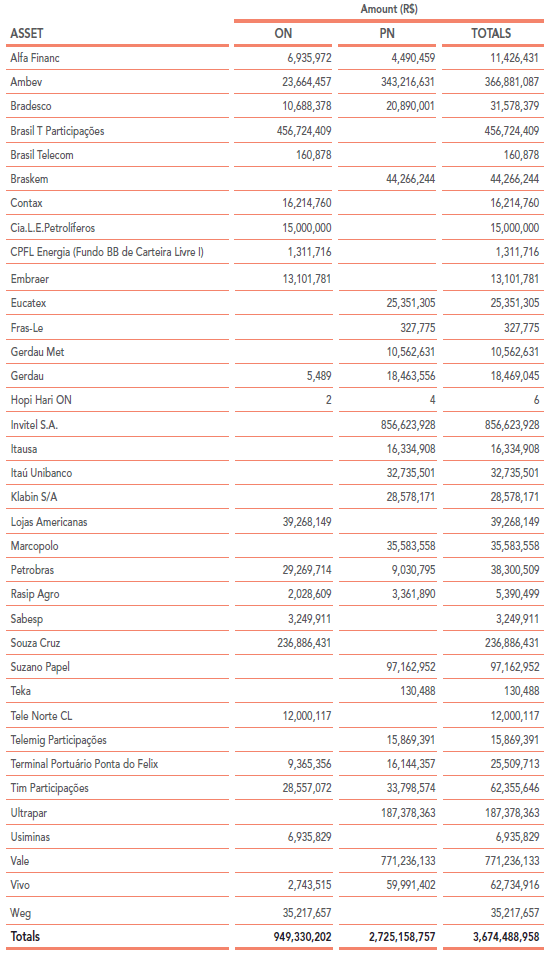
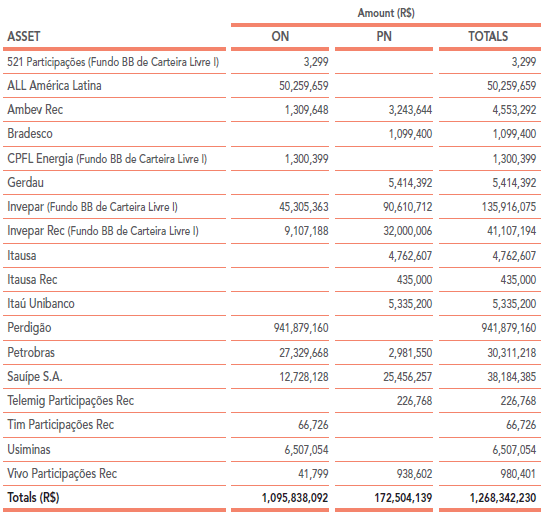
Stock sales totaled R$ 3.674 billion and the larger-scale operations involved shares from Vale, Invitel, Brasil Telecom Participações, Ambev, Souza Cruz and Ultrapar. Altogether, these represented 75% of sales. Purchases and subscriptions totaled R$1.268 billion, of which it is worth highlighting the subscription of R$941.8 million in shares of BR Foods (formerly called Perdigão), the payment of resources at Invepar and the conversion of debentures to stocks in ALL América Latina Logística, amounting to R$ 50.3 million.
Sales 2009
ALL - Conversion of Debenture in stock.
Perdigão - Public Stock Offer.
A venda de ações totalizou R$ 3,674 bilhões e as operações mais vultosas envolveram papéis da Vale, Invitel, Brasil Telecom Participações, Ambev, Souza Cruz e Ultrapar. Estas, reunidas, representaram 75% das vendas. Já as compras e subscrições somaram R$ 1,268 bilhão, tendo como destaques a subscrição de R$ 941,8 milhões em papéis da BRF Foods (ex-Perdigão), a integralização de recursos na Invepar e a conversão de debêntures por ações da empresa ALL América Latina Logística, no valor de R$ 50,3 milhões.
Dividends
Plan 1 received a total of R$2.69 billion in dividends and interest on equity (IE). The main payers were the financial institutions, as well as the electric power, mining (Vale) and oil (Petrobras) industries.
In 2008, Plan 1 received R$3.092 billion in dividends and IE. There was a reduction in dividend distribution, especially due to the fact that Vale’s distribution fell dramatically, from R$874 million in 2008 to R$395 million in 2009, as result of the fall in the company’s performance last year.
1.1 Portfolios
1.1.1 Stakes
The portfolio, which comprises companies in which PREVI participates as a core shareholder, is the largest in the variable income segment, with assets totalizing R$ 47.8 billion.
Invepar’s capital increase was aimed at regulating the entrance of the new shareholders Petros and Funcef, as well as guaranteeing the necessary resources for the expansion of business. PREVI’s integralization ocurred by divesting in the company Metrô-Rio. With the arrival of the new shareholders, PREVI’s stakes were diluted, from 83% to 51.38%, and in December 2009, the economic revaluation of these stakes resulted in the amount of R$ 1.12 billion, with a profitability of 326.81%.
This year also saw the acquisition of Sadia by Perdigão and the subsequent creation of the company BRF – Brasil Foods. The migration of shares took place in the second half of the year in Plan 1’s portfolio, culminating in the total transfer of Perdigão shares to the new BRF Foods stock in December 2009.
1.1.2 Market
The Market portfolio has assets in the amount of R$ 37 billion and is comprised of stocks that make up the index of IBrX-50. The portfolio achieved an appreciation of 92.12%, surpassing the reference index. This profitability was influenced extraordinarily by the transfer of CPFL stocks to the Market portfolio. If one were to leave out the effect of this transfer, profitability would have been of 76.34%, which is closer to the market’s reference indexes.
1.1.3 Special Management
The Special Management portfolio is comprised of stocks from companies that are not a part of the IBrX-50 index and that do not represent strategic stakes. In general, it is made up of smaller stakes that warrant special attention in the search for appreciation and liquidity. By the end of the year, this portfolio had a net worth of R$ 4.5 billion, achieving a profitability of 51.79%
1.1.4 Outsourced Portfolio
This portfolio is comprised of shares of investment funds. Known as entrepreneurial capital, private equity or venture capital, these funds are typically structured in the format of a “closed-end fund” that sponsors companies with considerable potential for growth and profitability.
PREVI participates in some private equity and venture capital funds geared towards fields of business that show development potential, such as infrastructure, logistics and innovation.
By the end of 2009, the Outsourced Portfolio was comprised of the following funds:
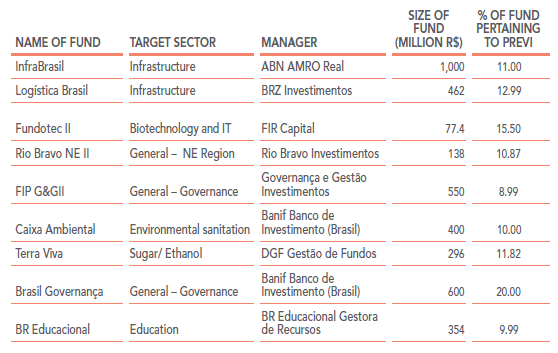
The Outsourced Portfolio represents less than 0.2% of the variable income segment. This portfolio had a negative profitability of 5.81%, which is common for this type of investment in its early phase. The fact is that in the first few years of every fund, investments are made in companies and projects that will only increase in value after the stakes are either sold or when the company opens its capital in the Stock market.
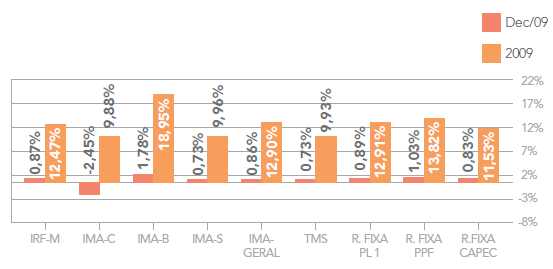
A rentabilidade do segmento de renda fixa no ano de 2009 foi de 12,91%, representando 130,01% da Taxa Média Selic (TMS), que foi 9,93%. A rentabilidade também superou a meta atuarial de 10,10%.
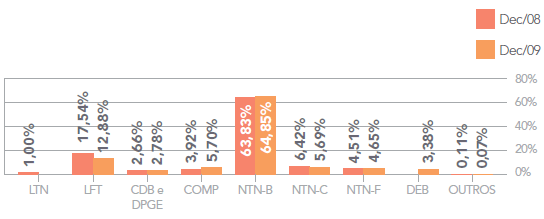
Among the assets that make up the fixed income segment, there is a predominance of NTN-B treasury notes, making up 64.9% of the Fixed Income investments, distributed among the “held to maturity” portfolio (50.6%) and the “for negotiation” portfolio (14.3%).
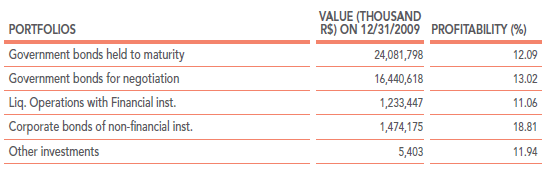
In 2009, the Government Bonds for Negotiation portfolio showed an accumulated profitability of 13.02%, basically as an effect of the NTN-B notes, which accounted for 37.47% of the portfolio, and the LFT bonds, with 33.87%. The IMA-B (Andima market index) was of 18.95% and the TMS was 9.93% - reference indexes for NTN-B and LFT notes.
If we take into account that most of the NTN-Bs are in the Held to Maturity portfolio, which are corrected by the Interest yield curve, these bonds did not follow the fluctuation of NTN-B notes marked to market, which is reflected by the Andima Market Index (IMA). Hence, the Held to Maturity portfolio had an accumulated profitability of 12.09% in 2009, lower than the IMA-B index.
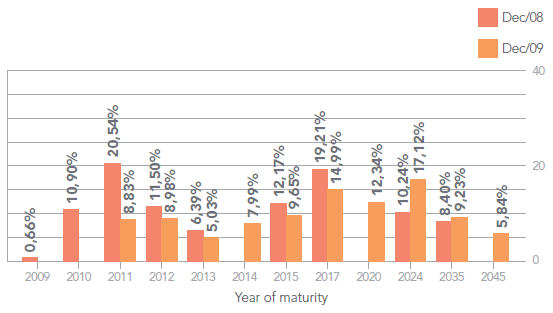
Regarding the allocation by maturity of the NTN-B assets, which make up the Held to Maturity portfolio, there was a change in the profile of the due date of the bonds in the period between Dec 2008 and Dec 2009. In Dec 2008, the NTN-Bs maturing between the years 2020 and 2045 made up 18.64% of the total NTN-Bs in the portfolio, whereas in Dec 2009, for this same time period, the allocation was of 44.53%, reflecting a lengthening of the due dates of said bonds.
In terms of investments in corporate bonds, by the end of the year, Plan 1 amassed R$ 1.459 billion in debentures, R$ 1.164 billion in time-deposits, R$ 43.48 million in Guaranteed time-deposits (DPGE), R$ 25.98 million IFC notes and R$ 4.75 million in FIDC Chemical IV.
The Guaranteed Time-Deposit asset (DPGE) was created by Resolution number 3.692/09 of the National Monetary Council and Plan 1’s first acquisitions of this asset was in April 2009.
Another noteworthy fact is the acquisition of subordinate certificates of deposit (CDBs) for a total of R$ 640 million, with rates of 115% of CDI and IPCA + 8.65%. The defining characteristic of these CDBs is the longer due date. This was the first time PREVI made an acquisition of this nature.
allocation of fixed income aSSetS
Andima indexes (IMA)
Monthly and Accumulated Profitability
ALLOCATION BY ASSET MATURITY ntn-b
The real estate segment had a profitability of 24.42% in 2009, exceeding the actuarial target of 10.10% by 13.01%, and surpassing the Fixed Income profitability of 12.91%. The net revenues strongly impacted this result. In 2009, these revenues (R$ 307.431 million) grew 26.38% in comparison to 2008 (R$ 243.257 million), achieving an accumulated profitability of 9.35%. The net revenue from shopping centers showed an increase of 10.45% in relation to the previous year.
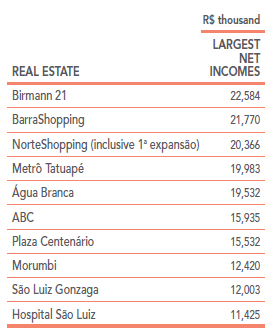
A total of 49 real estate properties, representing 73.83% of the Real Estate Portfolio, were revalued in 2009. In the first half of the year, the following assets are worth highlighting: Norte Shopping (Rio de Janeiro) (including the first expansion), which was revalued for a market value in the amount of R$ 92.054 million (book value, which takes into account the depreciation, of R$ 96.774 million) and had a profitability of 109.94% in 2009, and Shopping Metrô Tatuapé (São Paulo), valued in the amount of R$ 56.960 million in market value (and R$ 66.672 in book value) and had a profitability of 56.08% in 2009.
In the second half of the year, highlights include the revaluations of Shopping Barra (Bahia), with a market value in the amount of R$ 22.595 million (book value of R$ 24.559 million) and a profitability of 91.03% in 2009 and Birmann 21 (São Paulo), worth R$ 33.208 million in market value (book value of R$ 36.322 million) and a profitability of 27.81% in 2009.
Throughout the year, 12 properties were sold in the sum total of R$ 195.296 million. Among these, it is worth highlighting the hotel located in Copacabana, Rio de Janeiro.
4 Loans & Financing
Plan 1’s portfolio of simple loans reached the end of the year with a total of R$ 2.081 billion in loans, corresponding to a total of 65,581 active contracts.
The profitability in 2009 was of 10.63%, whereas the actuarial target was 10.10%.
4.2 Carim (mortgage)
The profitability of Plan 1’s mortgage portfolios was of 10.44% and the actuarial target was of 10.10%.
By the end of the year, the portfolio had handed out R$ 2.8 billion in mortgage loans, corresponding to 28,594 active contracts. Among these active contracts, 3,155 account for operations that were initiated since the reinstatement of the portfolio in 2007, in the amount of R$ 390 million and representing 13.8% of the total financial volume.
In 2009 alone, 751 new operations were contracted and R$ 102 million were paid out, which corresponds to an average of R$136.460 thousand per mortgage in the year.
All of the 9,237 participants that showed an interest in taking out a loan to finance the purchase of a home received a letter of acceptance in 2009, including cases in which the participant was taking on a second loan.
In 2009, 1,310 contracts were liquidated, either with the participants own resources, using resources from the FGTS or from the simple loan line of credit – ES Finimob, resulting in a return of resources in the amount of R$ 62.3 million.
The partnership agreement with the bank Caixa Econômica Federal that allows workers to use their FGTS to finance the purchase of real estate property, which expires in July 2010, resulted in the full payment of 39 contracts for a total of R$ 2.5 million.
ES Finimob is a line of credit aimed towards complementing personal resources or resources from the FGTS in order to fully pay, up front, the contracts of financing private property. In 2009, 96 mortgagees made use of this line of credit to finish paying off their loans.
Contractual Adjustments
From April to October 2009, the mortgagees of the portfolios with a “PCE” type contract (signed between the years of 1989 and 1995) and a GT 1 – Adesão type contract (PCE contracts that were renegotiated between October 1998 and May 2001) were given another opportunity to adjust their contracts under the same premises as those in the Nova Carim Project, offered in 2003 and 2005. From a target group of approximately 3,000 mortgagees, 487 chose to make the contractual adjustment and 453 paid off all their contracts in advance, making use of the advantages of discounts of at least 15%.
Debates over Plan 1 surplus remain suspended
The debates regarding the use of Plan 1’s surplus that appeared at the end of the 2007 and 2008 remain suspended due to pending legal issues relating to Resolution number 26, published in 2008 by the Secretary of Complementary Social Security [Secretaria de Previdência Complementar], as well as the impact of the economic crisis, which brought considerable instability to the 2008 results.
From an economic standpoint, it is possible to resume these debates, but the discussions should take into account the regulatory environment. In addition to a technical and legal analysis, the process must undergo a number of formal and legal stages until an effective decision can be made regarding the allocation of the surplus.
Accumulated surplus (R$ Billions)
Benefits Payment
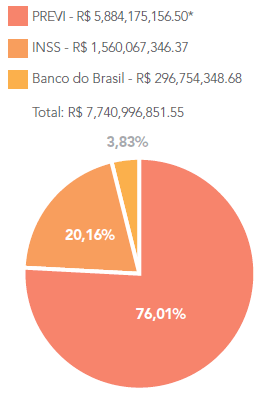
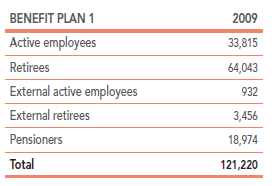
In 2009, Plan 1 paid R$ 5.884 billion worth of benefits to 87,460 retirees and pensioners. The benefits payment is supported by revenue from the yield from the applications, rent payments, dividends, bond interests and sales of assets.
The lump sum of these outgoing payments naturally tends to increase with time. The average age of the active participant of Plan 1 is 47, with an average of 24.5 years of involvement with the plan. In the next 15 years, approximately 34,000 active participants will have attained the necessary conditions to retire.
* With BPD Benefits (Benefício Proporcional Diferido)
Total number of beneficiaries (as of Dec/2009)
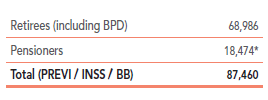
* The amount of pension payments reflects the family unit, obeying the concession criteria of Brazil’s social security system (INSS), where each social security number corresponds to one enrollment in PREVI. This is not the same as the number of beneficiaries actually receiving pension payments, since a single family unit may contain more than one beneficiary (for example, a widow with two under-age children = one single PREVI enrollment).
