EXPLANATORY NOTES 1.Operational Context 2. Benefit Plans 3. Presentation of the Financial Statements 4. Relevant Fact
5. Main Accounting Practices 6. Receivables - Pension Program 7. Receivables - Investment Program 8. Fixed Income 9. Variable Income 10. Real Estate Investments 11. Operations with Participants
12. Investments - PREVI Futuro Plan 13. Investments - Annuity Portfolio - CAPEC 14. Operating Liabilities 15. Contingency Liabilities 16. Actuarial Liabilities 17. Mathematical Provisions - Benefit Plan 1 18. Mathematical Provisions - PREVI Futuro 19. Technical Balance 20. Found 21. Income Statement
INCOME STATEMENT
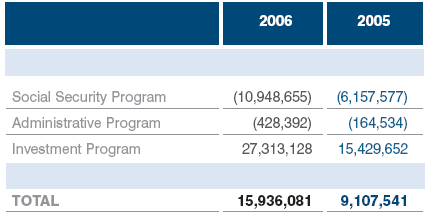
The chart below demonstrates the summarized income composition without the inter-program transfers:

The annual income was of R$ 15,936,081 thousand (R$ 9,107,541 thousand in 2005). As a consequence, the accumulated positive balance reached R$ 34,806,387 thousand. A great contribution in this case was the profitability of the investments in variable income (47%) and in fixed income (18%), which was above the actuarial target of 9% (INPC + 6º p.a.).
The variable income segment, with participation of 64% in the investments at the end of the year, was strongly influenced by the good performance of the stock exchange.
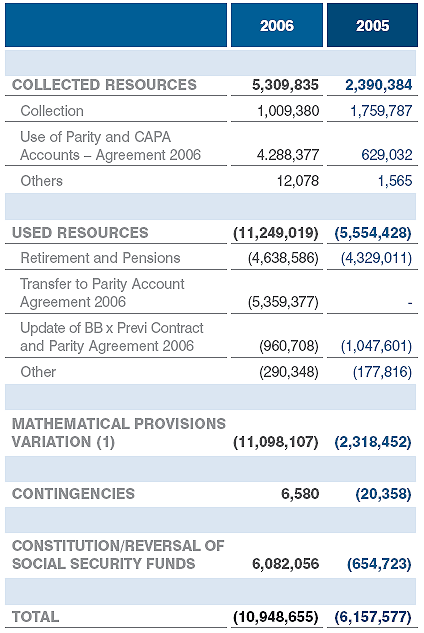
a) Social Security Program

CAPA Account: Advanced Patronal Amortizing Contributions
(1) Comments in item 16 of these Notes
b) Administrative Program
The result of the Administrative Program reached R$ 428,392 thousand (R$ 164,534 thousand in 2005). In the variation of R$ 263,858 thousand is computed the transit of the supply to the Administrative Fund mentioned in item 16-b of these Notes.
For the identification of the administrative expenses incurred by the common areas, division criteria are used concerning the expenses of the personnel allocated in each area (social security and investment) and the percentage of the physical area occupied by these activities.
In the verification of the investment administrative costing of the benefit plans, a percentage of participation of the assets of each plan is applied to the investment administrative expenses.
Upon the application of the division parameters between the programs, the percentage verified was of 63.3% for the investment administration and 36.7% for the social security administration.
The administrative expenses reached the amount of R$ 133,187 thousand in the year (R$ 125,300 thousand, in 2005), equivalent to 15% of the normal social security contributions (already computing the impact of the 40% reduction on the personal and patronal contributions), of which 5.5% was social security administrative expenses and 9.5% investment administrative expenses.
c) Investment Program
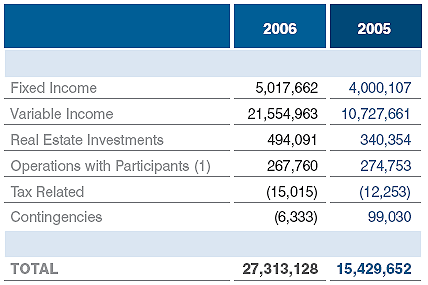
This group includes the net variations and income resulting from the investment pf resources of the plans, as follows:

(1) Including the variation of the Settlement for Death and Liquidity Funds
The following events, among others, determined the variable income result: (i) variation of the stock market (R$ 10,438,112 thousand); (ii) revenue of dividends/JCP in its own portfolio (R$ 1,661,706 thousand) and (iii) net variation in investment funds (R4 7,060,135 thousand), which includes adjustments at economic value of Neoenergia, Litel/Vale do Rio Doce and 521/CPFL/Neoenergia and dividends of approximately R$ 795,707 thousand.
Of the total R$ 27,313,128 thousand verified as the result of the Investment Program, R$ 27,126,731 thousand was transferred to the Social Security Program and R$ 186,397 thousand to the Administrative Program, as administrative costing of the investments (R$ 82,267 thousand) and remuneration of the Administrative Fund (R$ 104,130 thousand).
Part of the value transferred to the Social Security Program was consumed by the events that affected the Mathematical Provisions, already commented in item 16 of these Notes.
